
InduBa Simulator: tick-by-tick analysis
Our simulator analyses your energy profile at 15-minute intervals. Below, two real analyses: a furniture workshop with EMS data and a grain processor with simulation data. 40% of our enquiries turn out not to be profitable. For these two businesses, they did.
📸Proof: real EMS screenshots
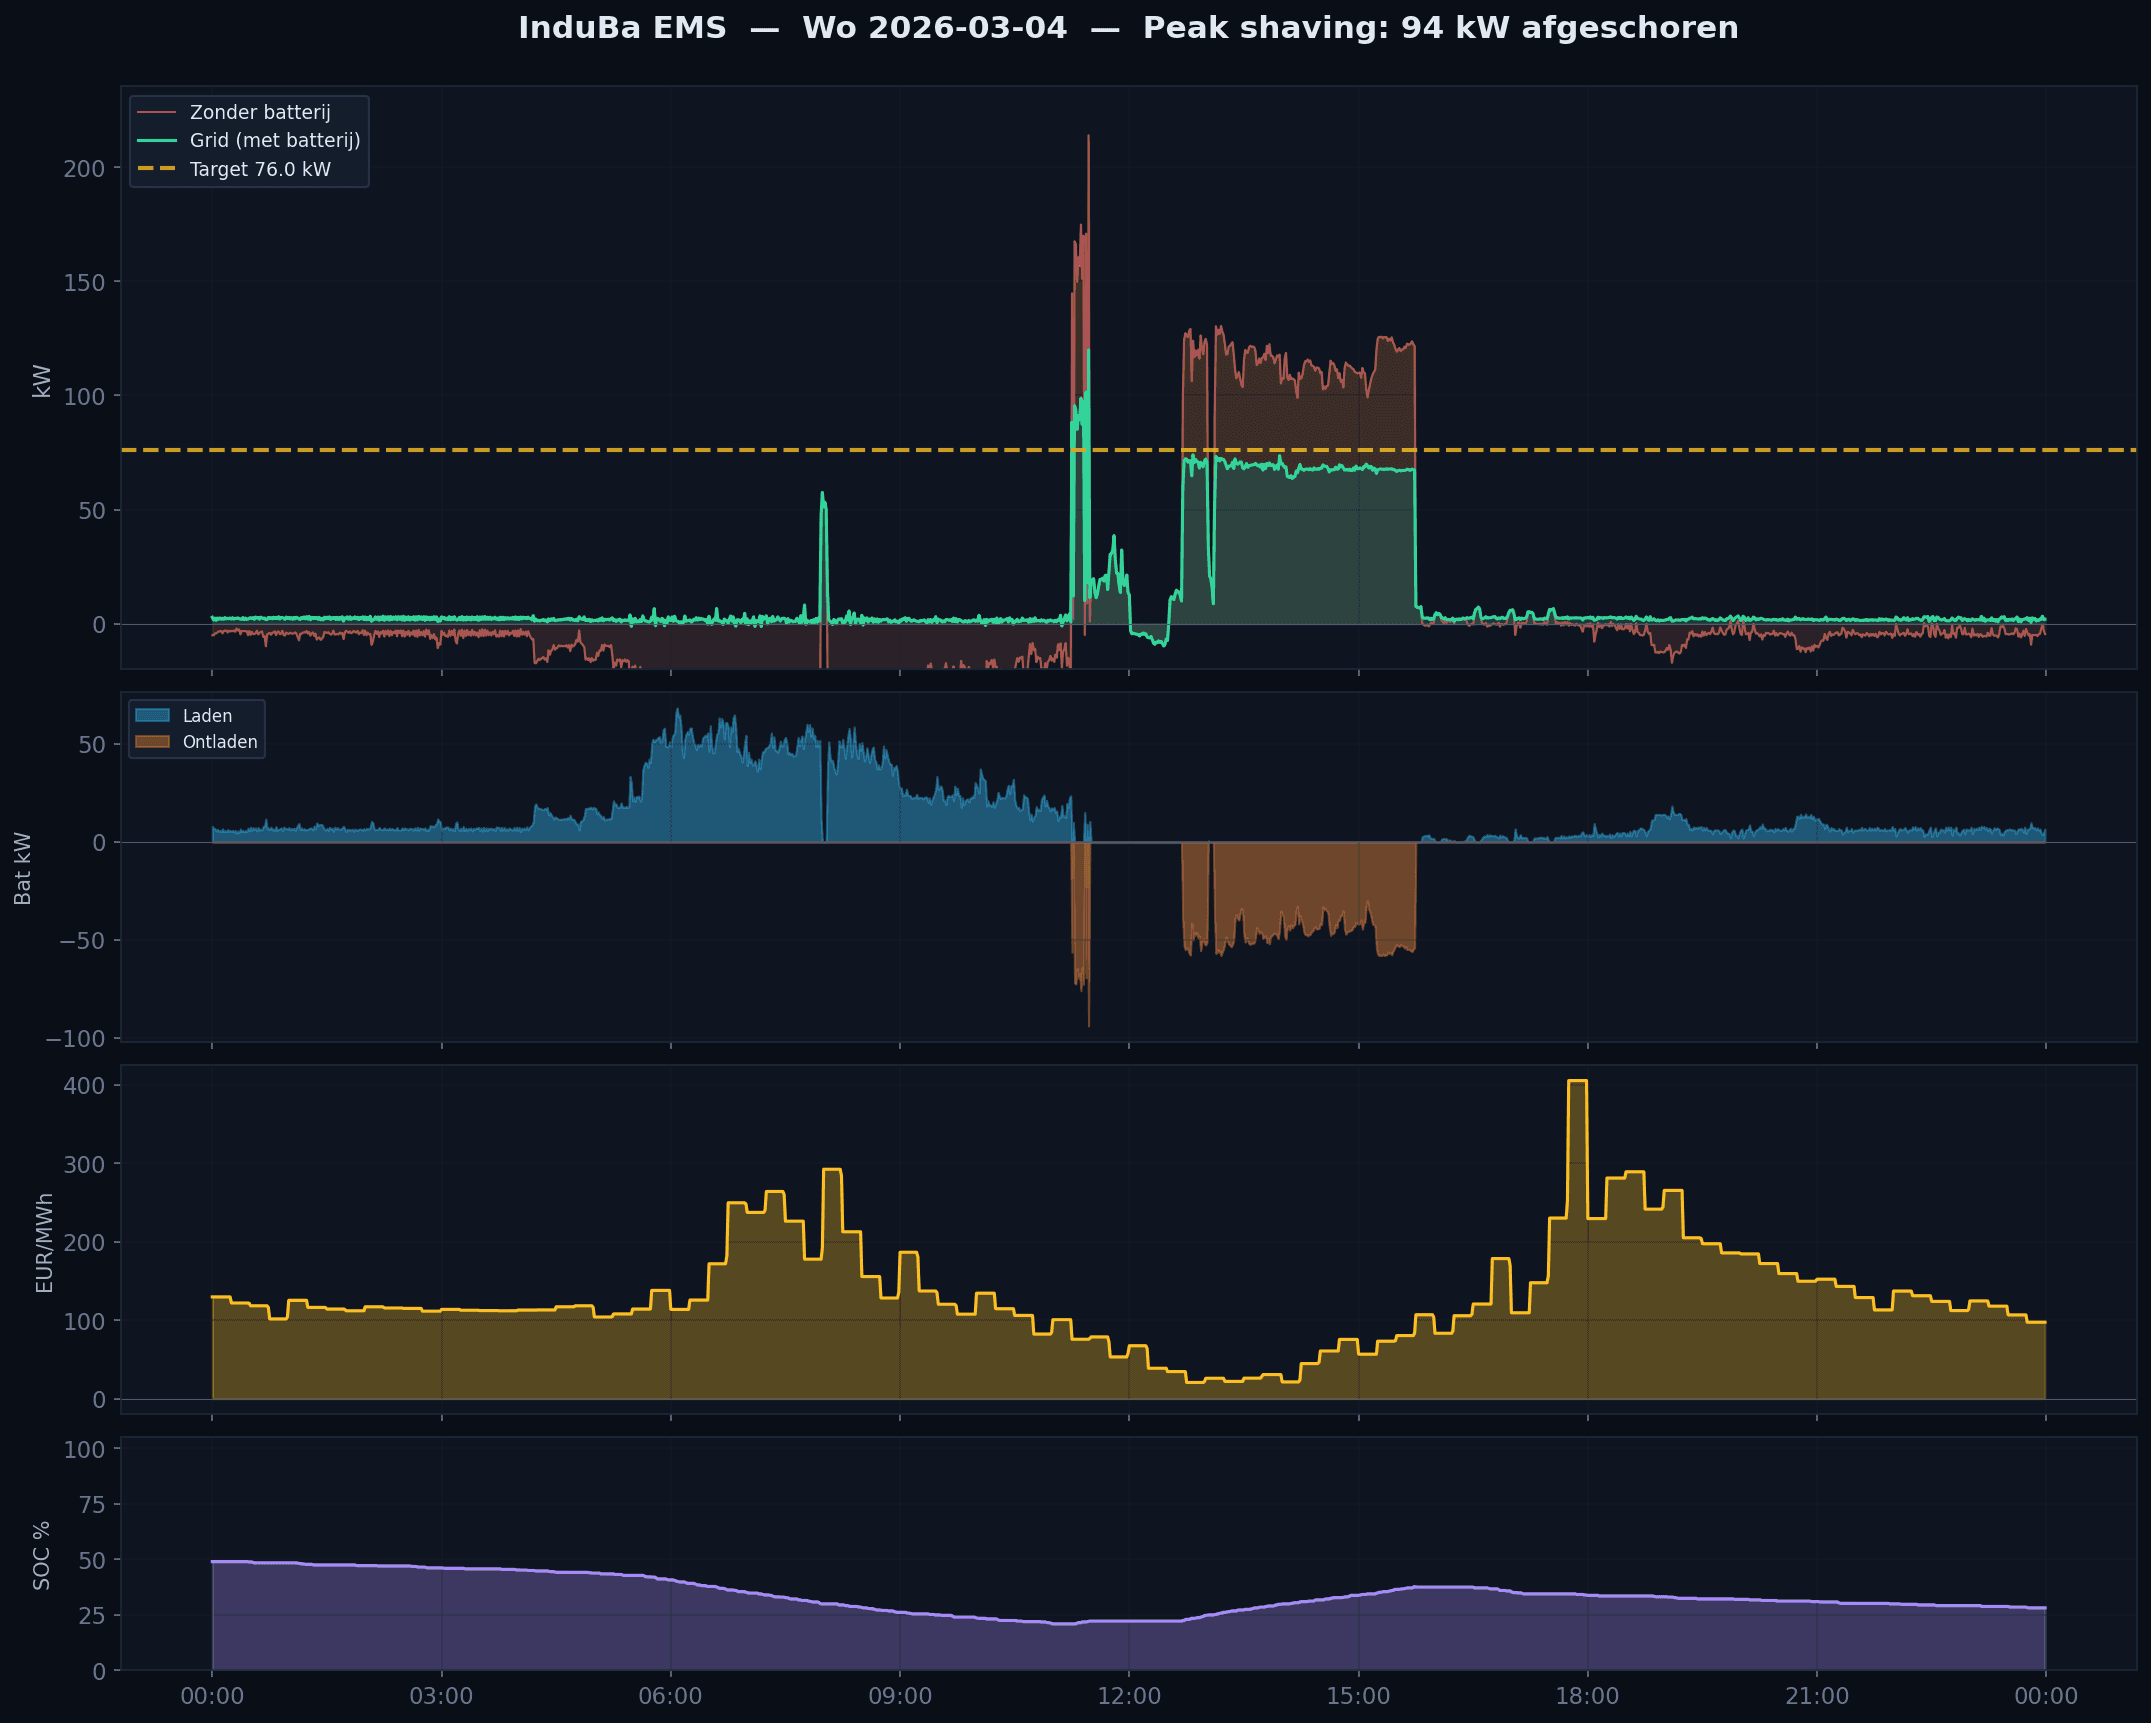
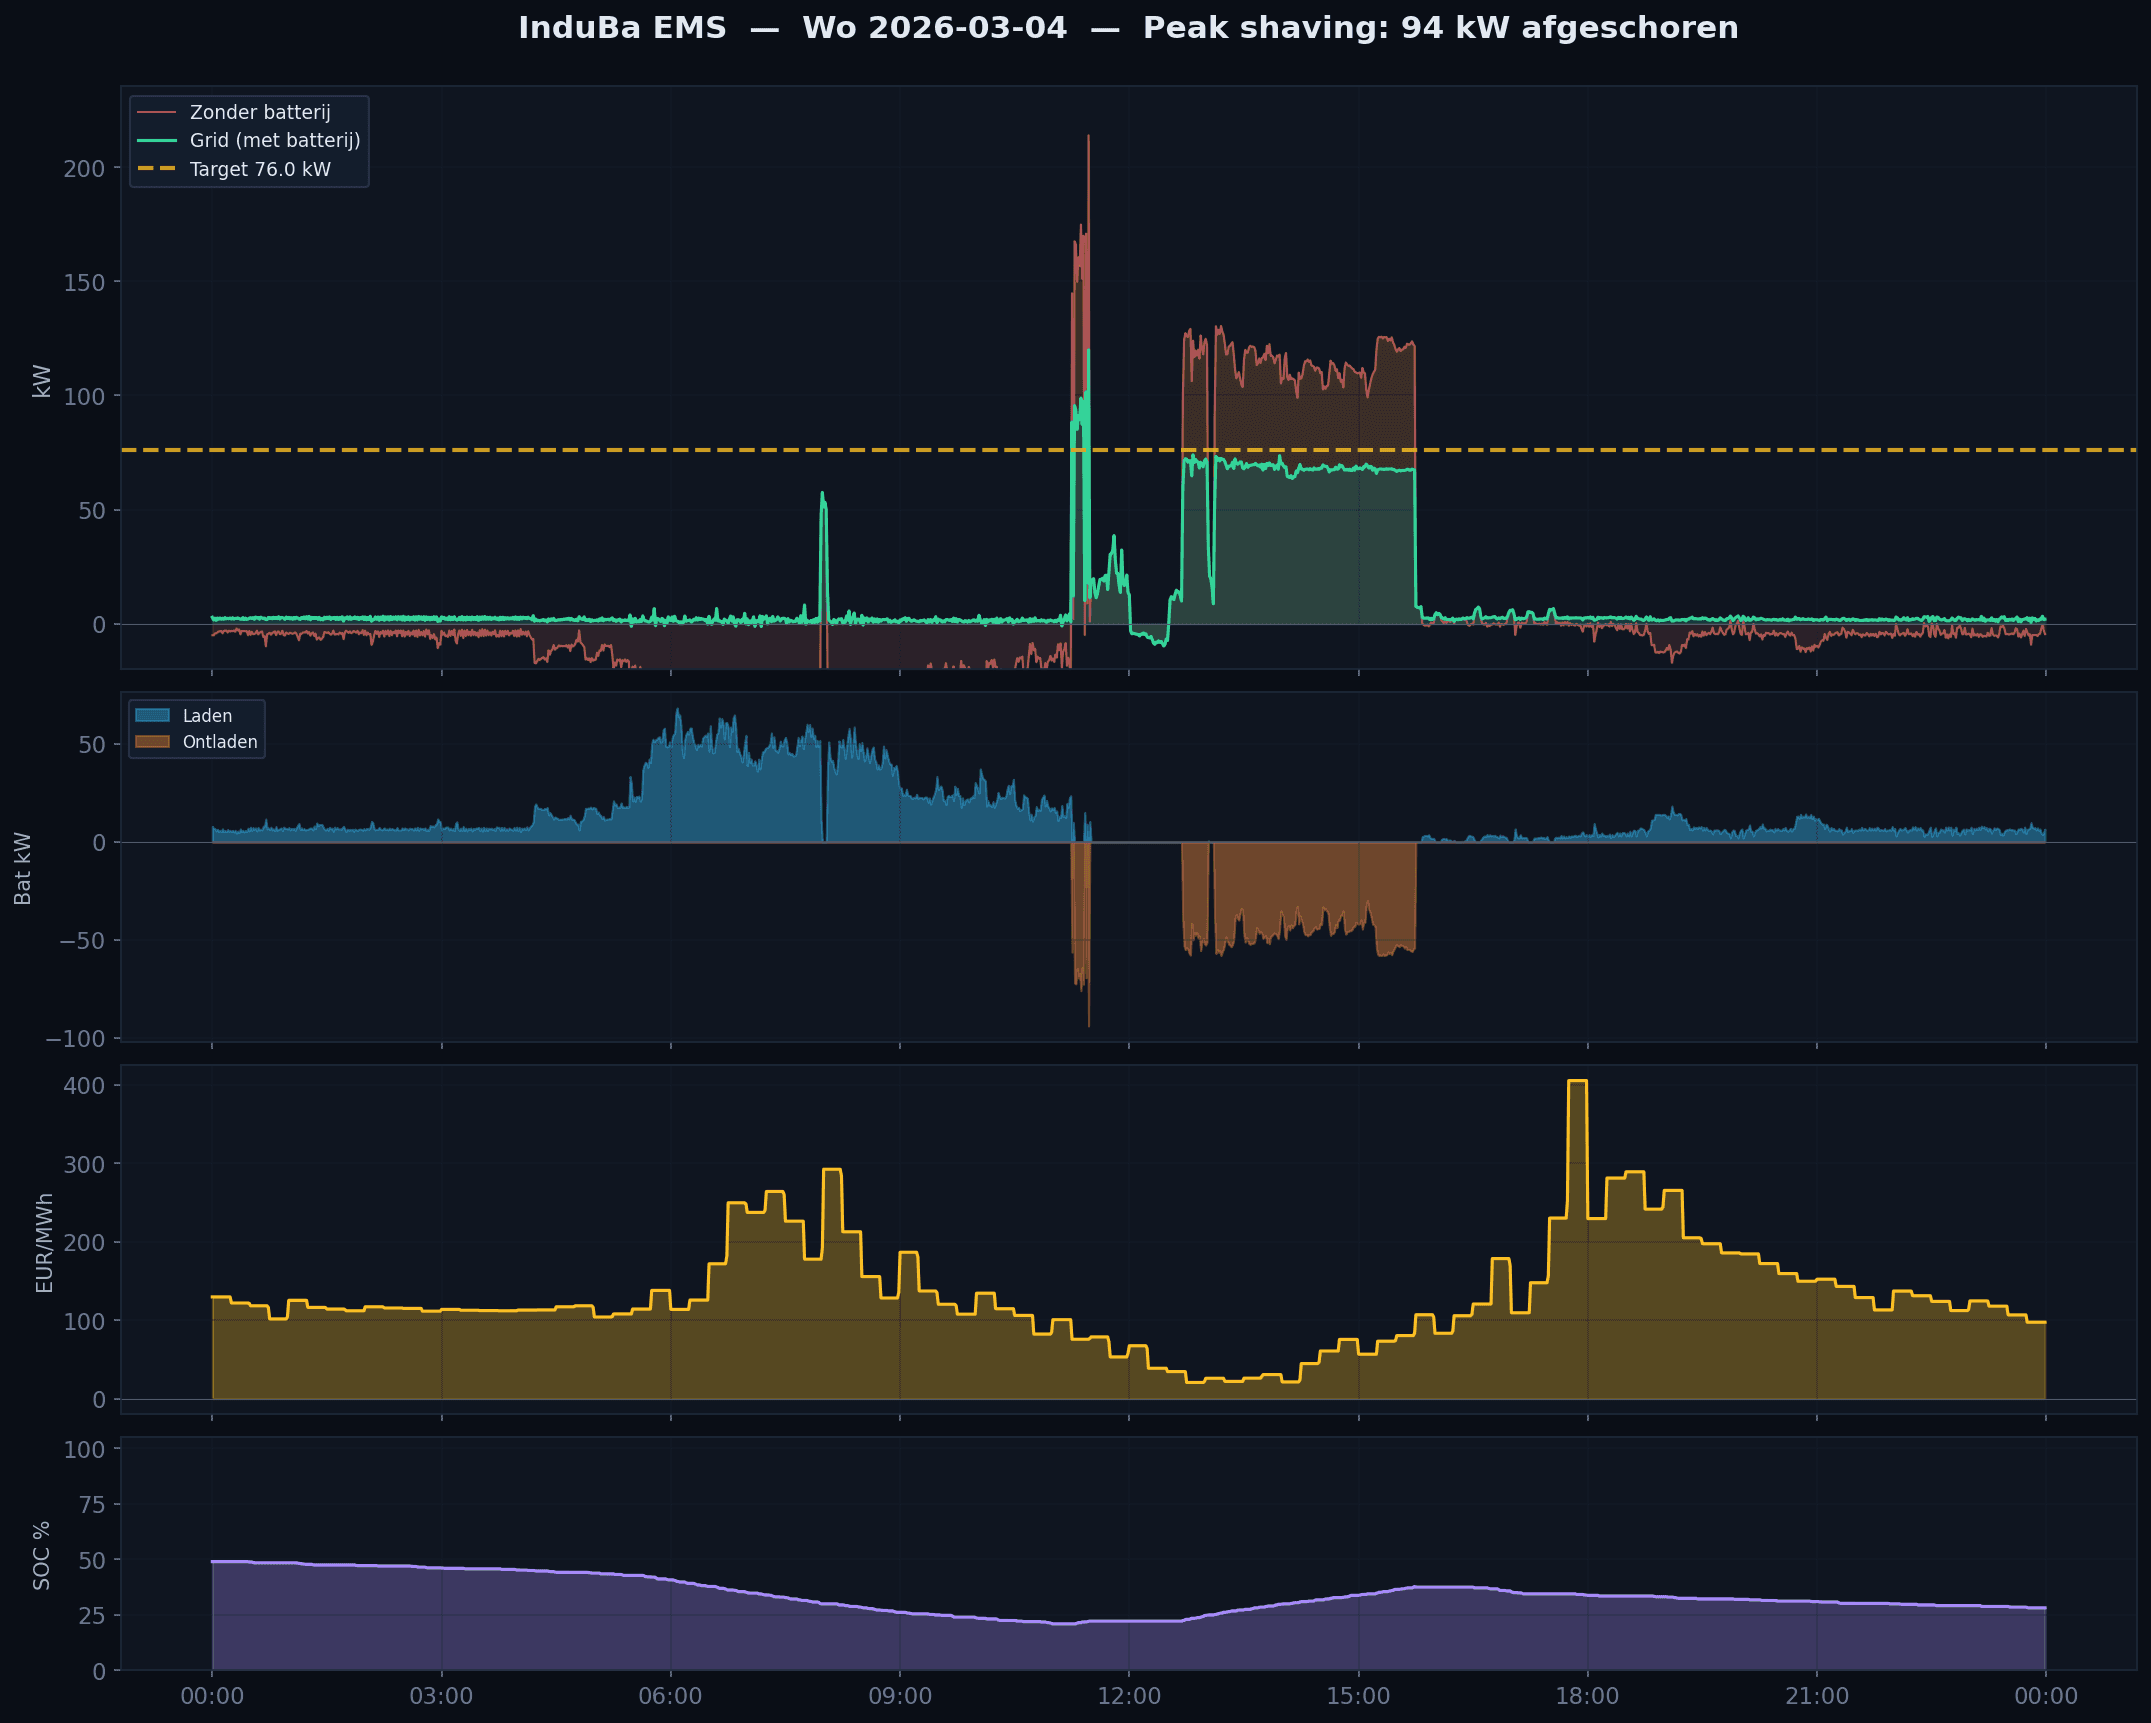
Screenshots of the real InduBa EMS dashboard, Wednesday, 4 Mar 2026
Piek + prijspiek: de dubbele klapPeak shaving
94 kW afgeschoren bij een piek van 170 kW om 08:45. GridShield hield het net op exact 76 kW. Tegelijk steeg de EPEX-prijs tot €405/MWh — de batterij ontlaadde op het duurste moment van de dag. Dubbel rendement: piekafschaving + prijsarbitrage in één interval.
Peak
170 → 76 kW
Shaved
94 kW
SOC range
39%-86%
Would you like this for your business?
We simulate it on your own data, every 15 minutes, with real EPEX prices.
How does the simulator work?
- 📊Real invoice data: your consumption per 15-minute interval, straight from your digital meter or bill
- 💰Historical EPEX prices: no estimates, but the actual day-ahead prices of the Belgian market
- ☀️PV production: measured data or a projection based on local sun hours and panel orientation
- 🔋Per quarter-hour: what would the battery have done? Charge, discharge, peak shave, or wait?
What you get
- ✓A full report with every day analysed
- ✓Savings breakdown per category: capacity tariff, self-consumption, EPEX arbitrage
- ✓Configuration advice: which system, which capacity
- ✓An honest verdict, including 'no' when it isn't profitable
Would you like this for your business?
Send your energy invoice or quarter-hour peak data. We run the simulation within 48-72 hours. Honest, even if the answer is no.