Download your Fluvius data
Getting your quarter-hour values out of Mijn Fluvius takes a few minutes. With that one CSV file we calculate exactly what a battery would deliver for your business, based on your real consumption.
Which file do you need?
- Energy
- Electricity (not gas)
- Level of detail
- Quarter-hour totals (Kwartiertotalen)
- Format
- CSV file
- Period
- At least 3 months, ideally 12 months
Step 1 of 5
Log in to Mijn Fluvius
Open mijn.fluvius.be in your browser. Which account you choose depends on how your electricity is invoiced:
- Persoonlijk account (personal account): you receive the energy invoice as a private individual, in your own name.
- Professioneel account (professional account): you are a company with a VAT number and the invoice is in the company's name.
Not sure? Check whose name is on your energy invoice.
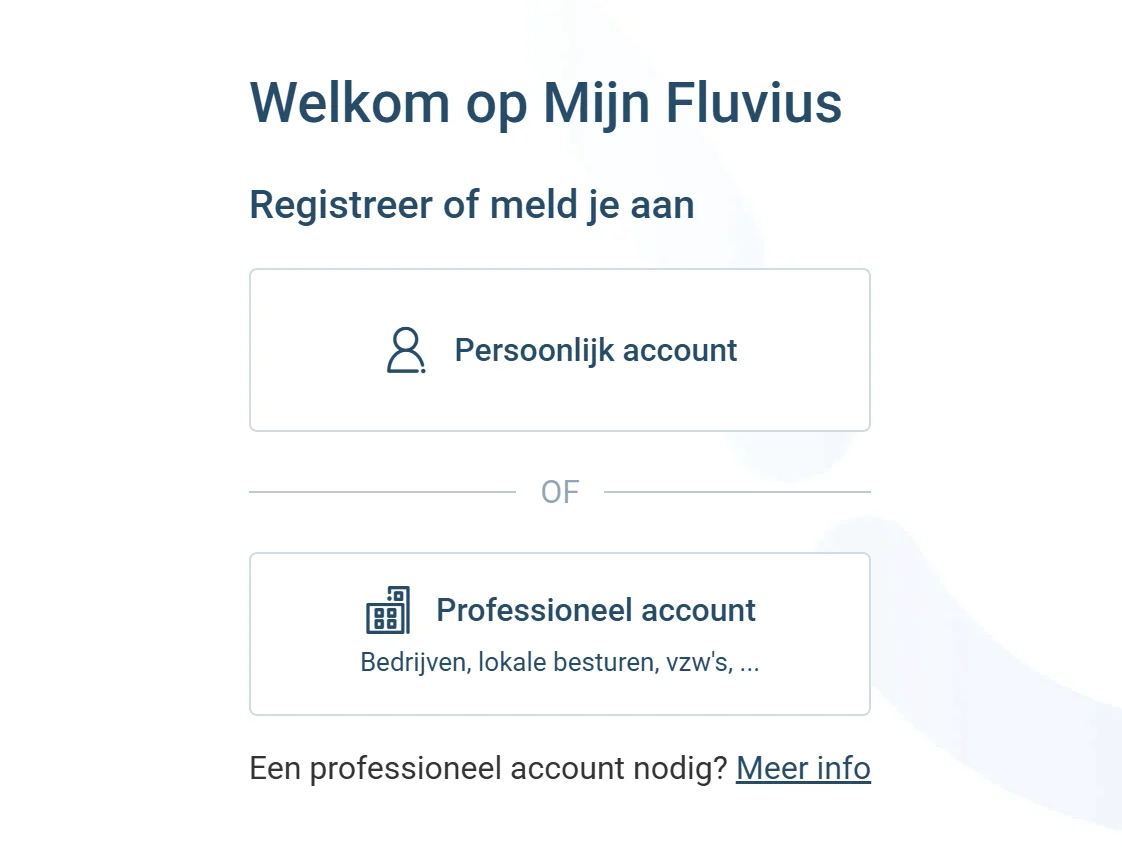
Then sign in. With a personal account you can use itsme or your e-mail address and password. With a professional account you use the e-mail address and password of your business account.
Step 2 of 5
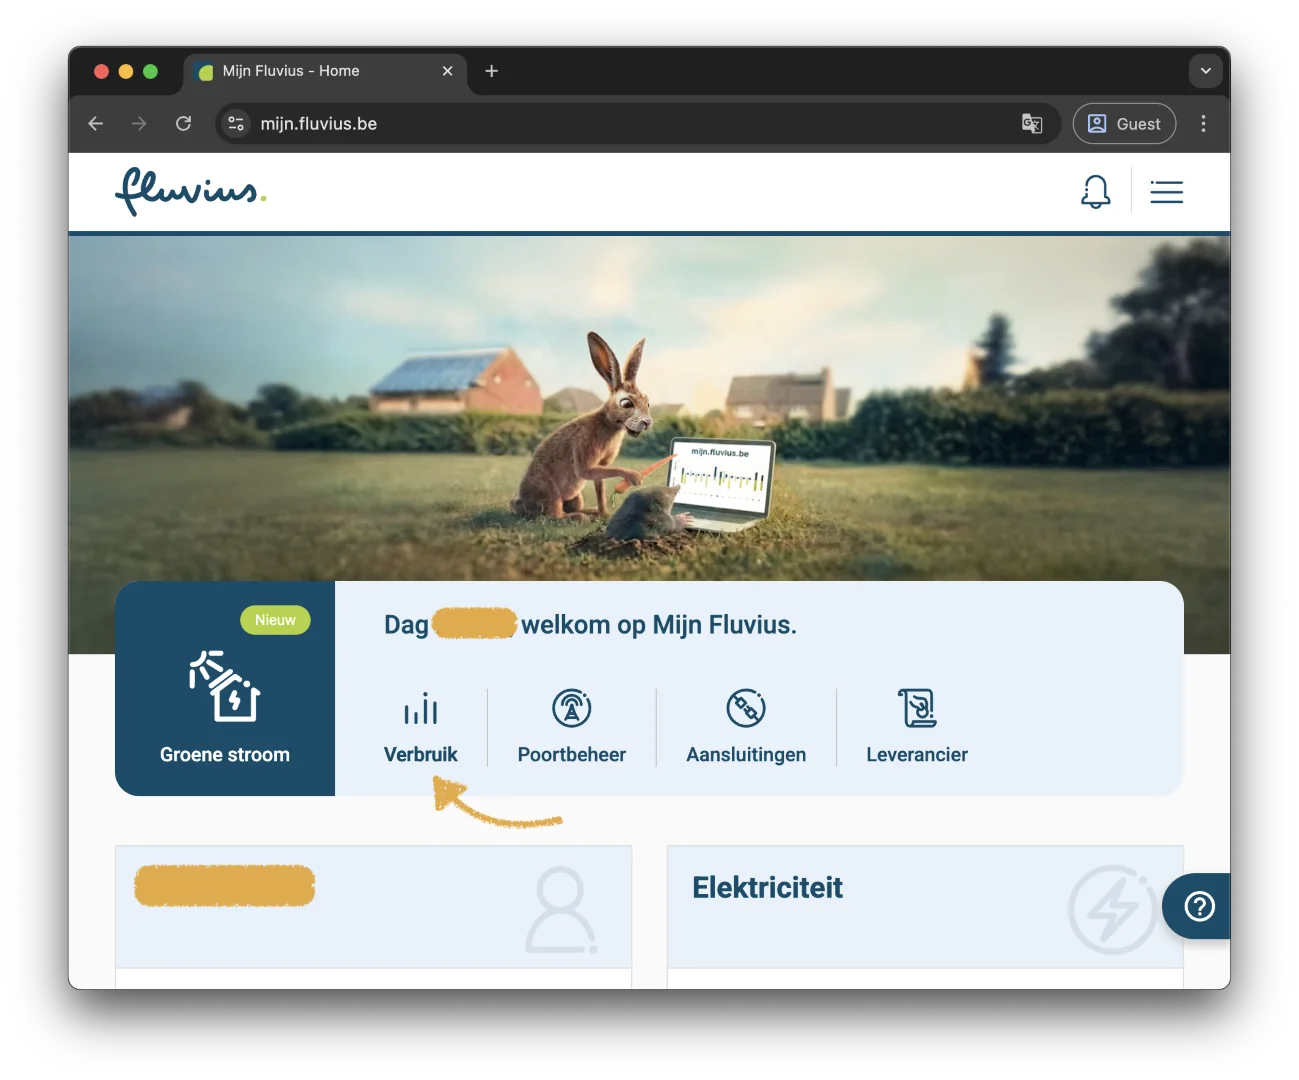
Open Verbruik
After signing in you land on the Mijn Fluvius home page. Click Verbruik (consumption) in the welcome bar.
Step 3 of 5
Check that you have access to your quarter-hour values
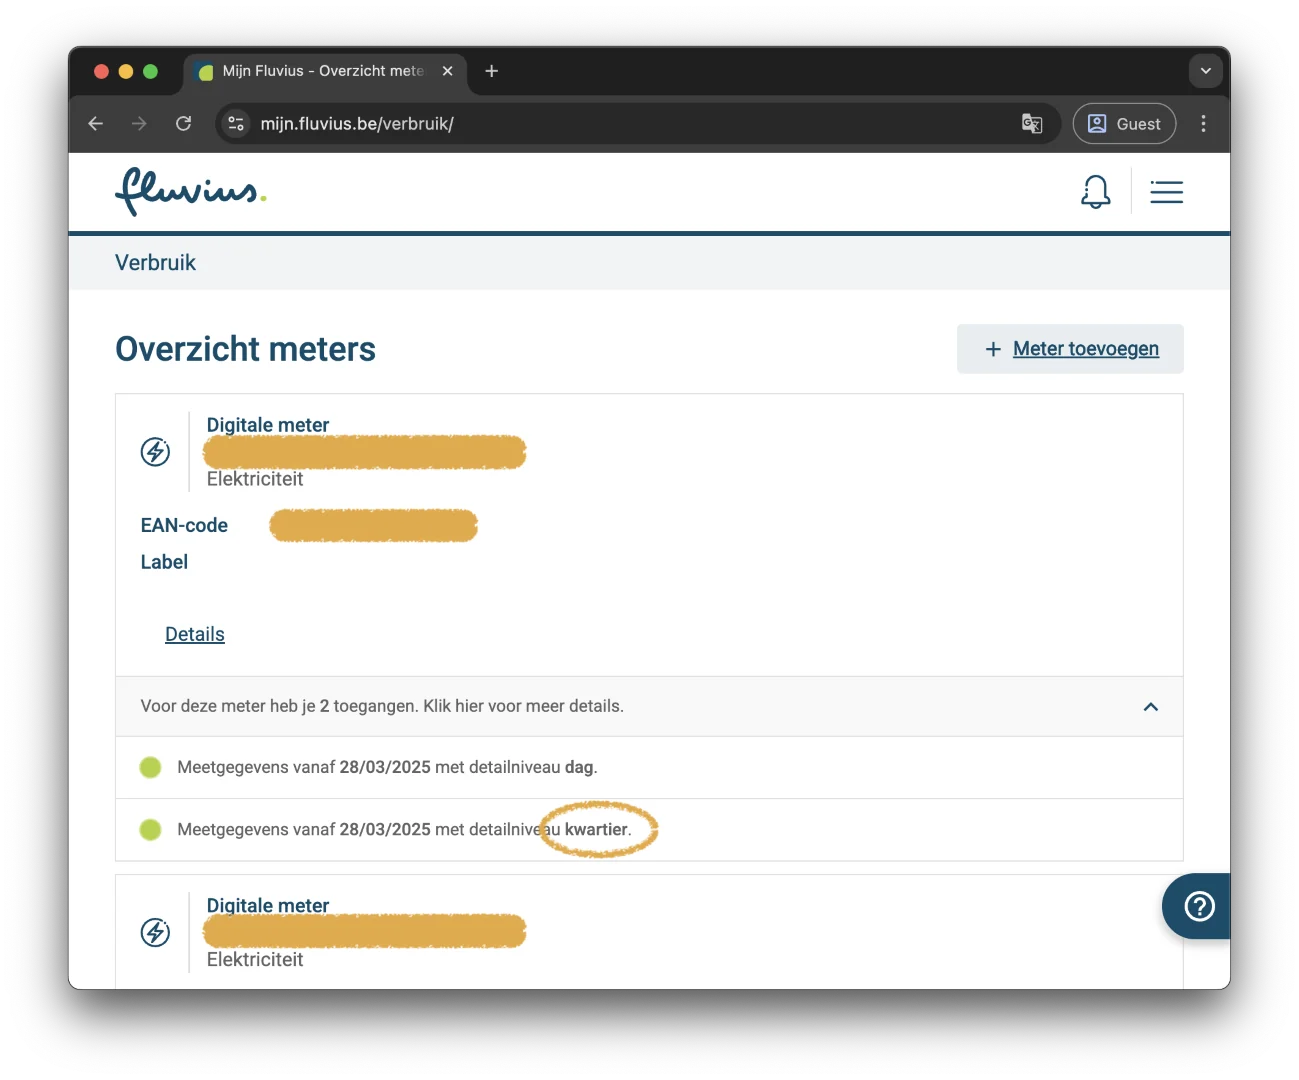
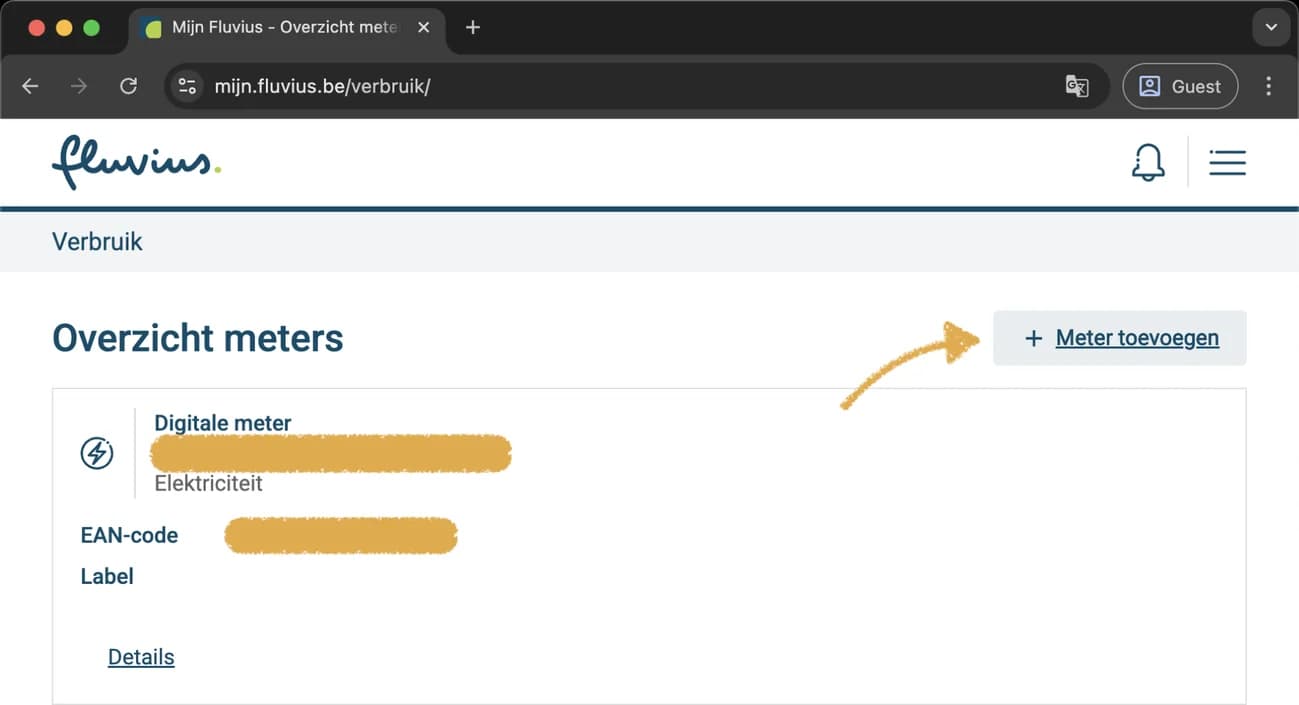
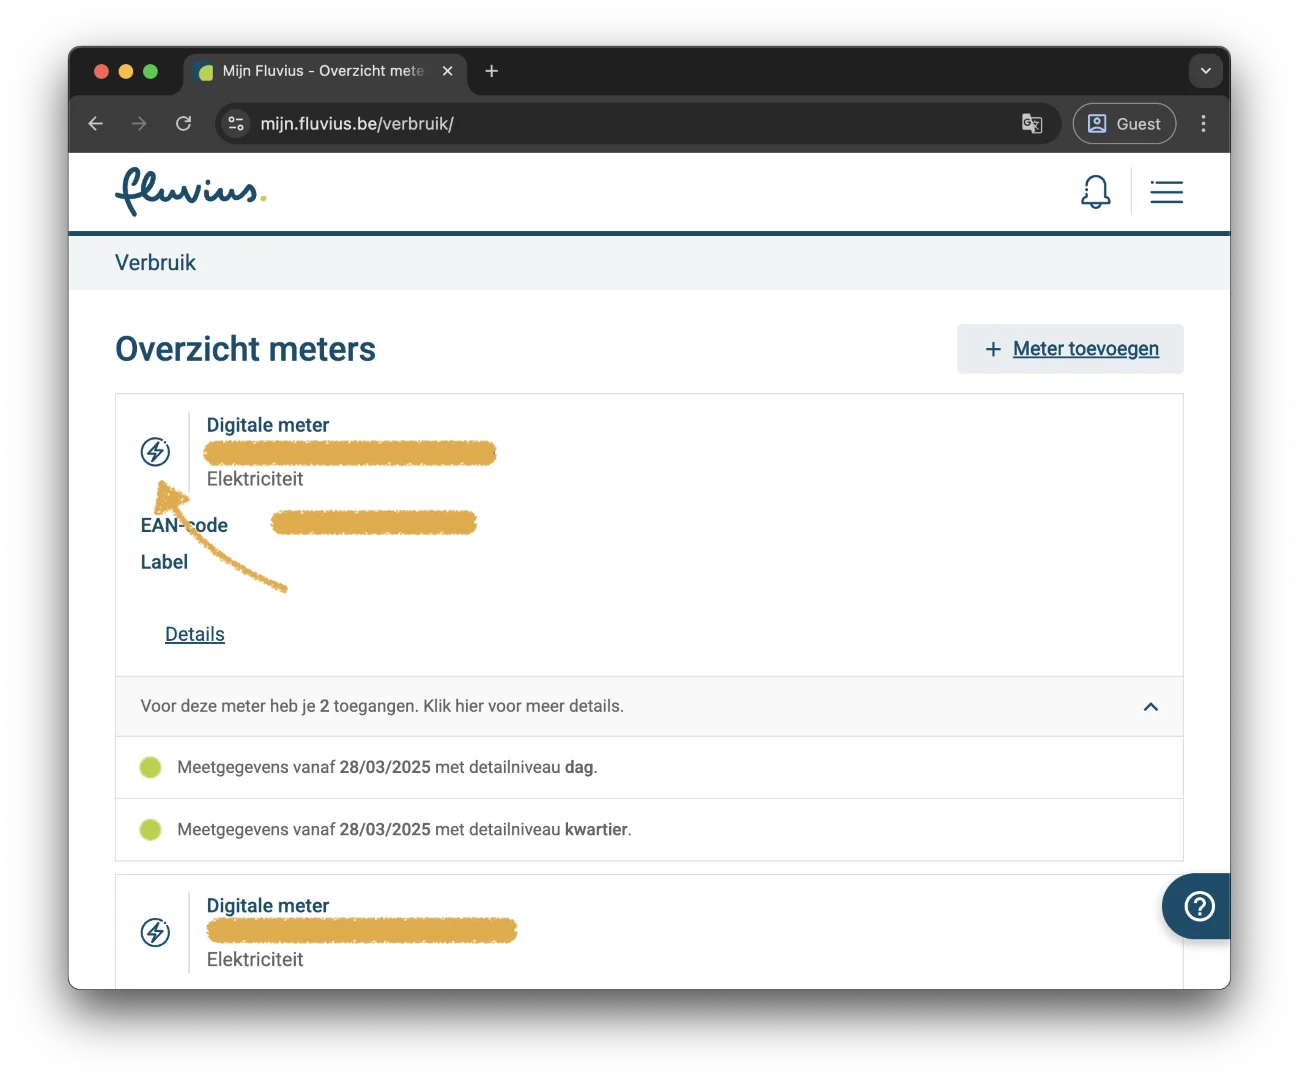
You now see the Overzicht meters (meter overview) with your electricity meter. Expand the line with your access rights below it.
Does it say Meetgegevens vanaf … met detailniveau kwartier (measurement data from … at quarter-hour level)? Then you have access to your quarter-hour values: continue with step 4.
No quarter-hour values? Request them once
No line at quarter-hour level, or your meter is not listed? Then request access once:
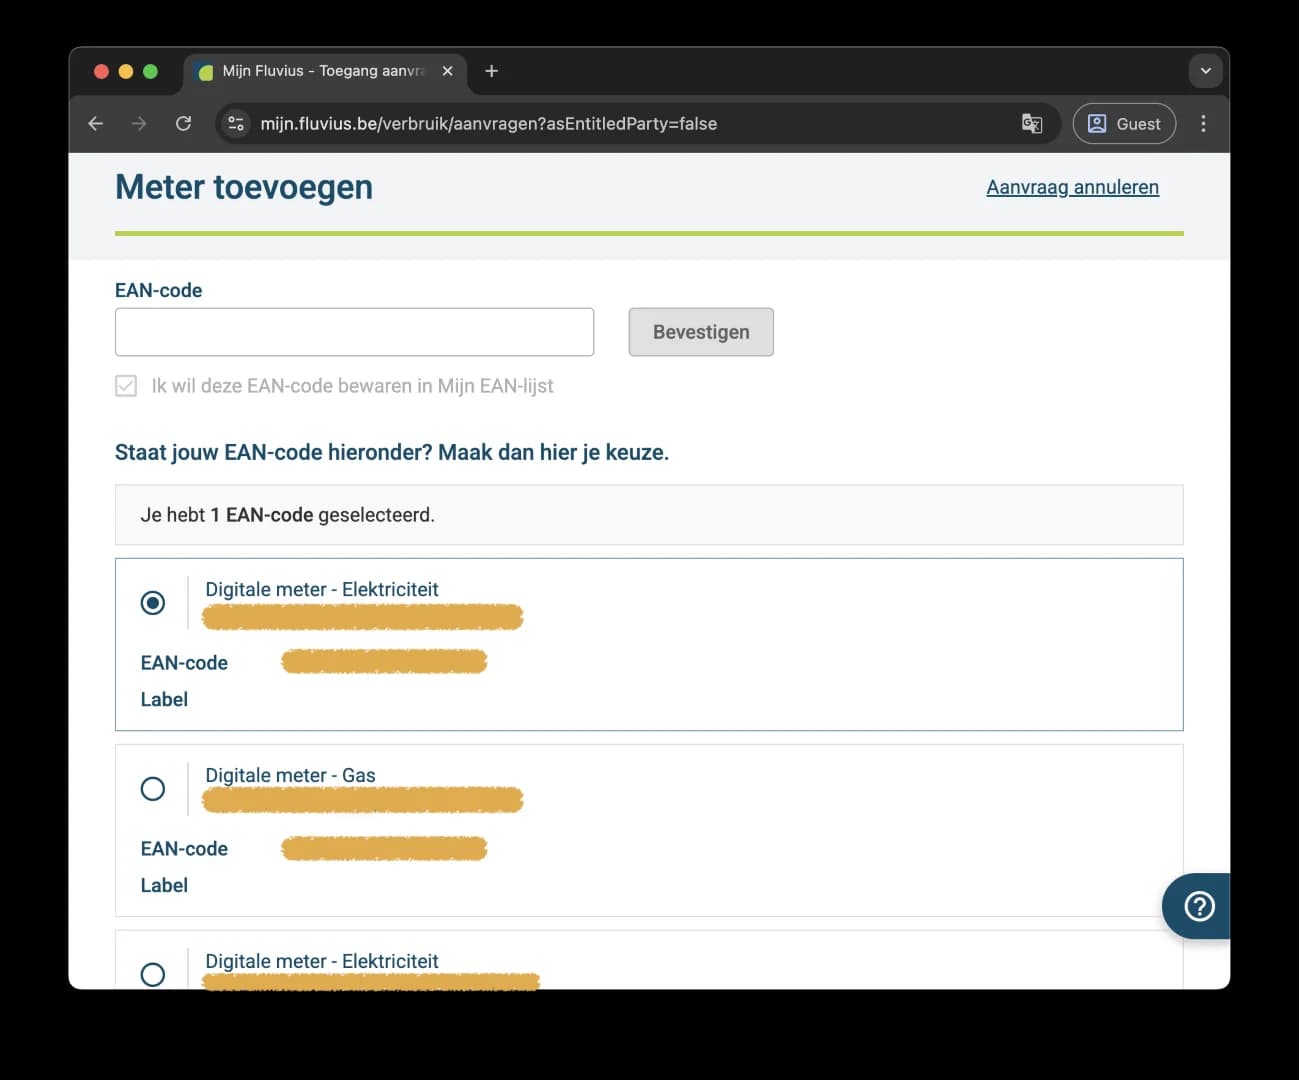
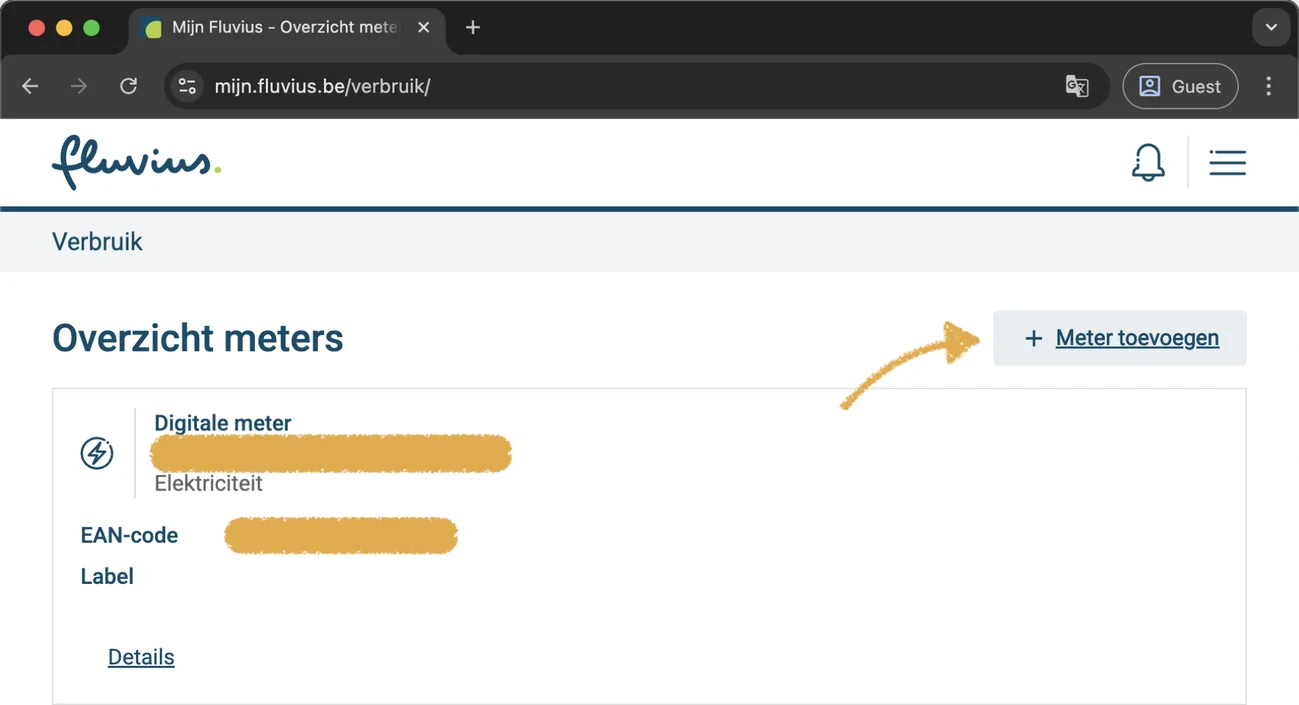
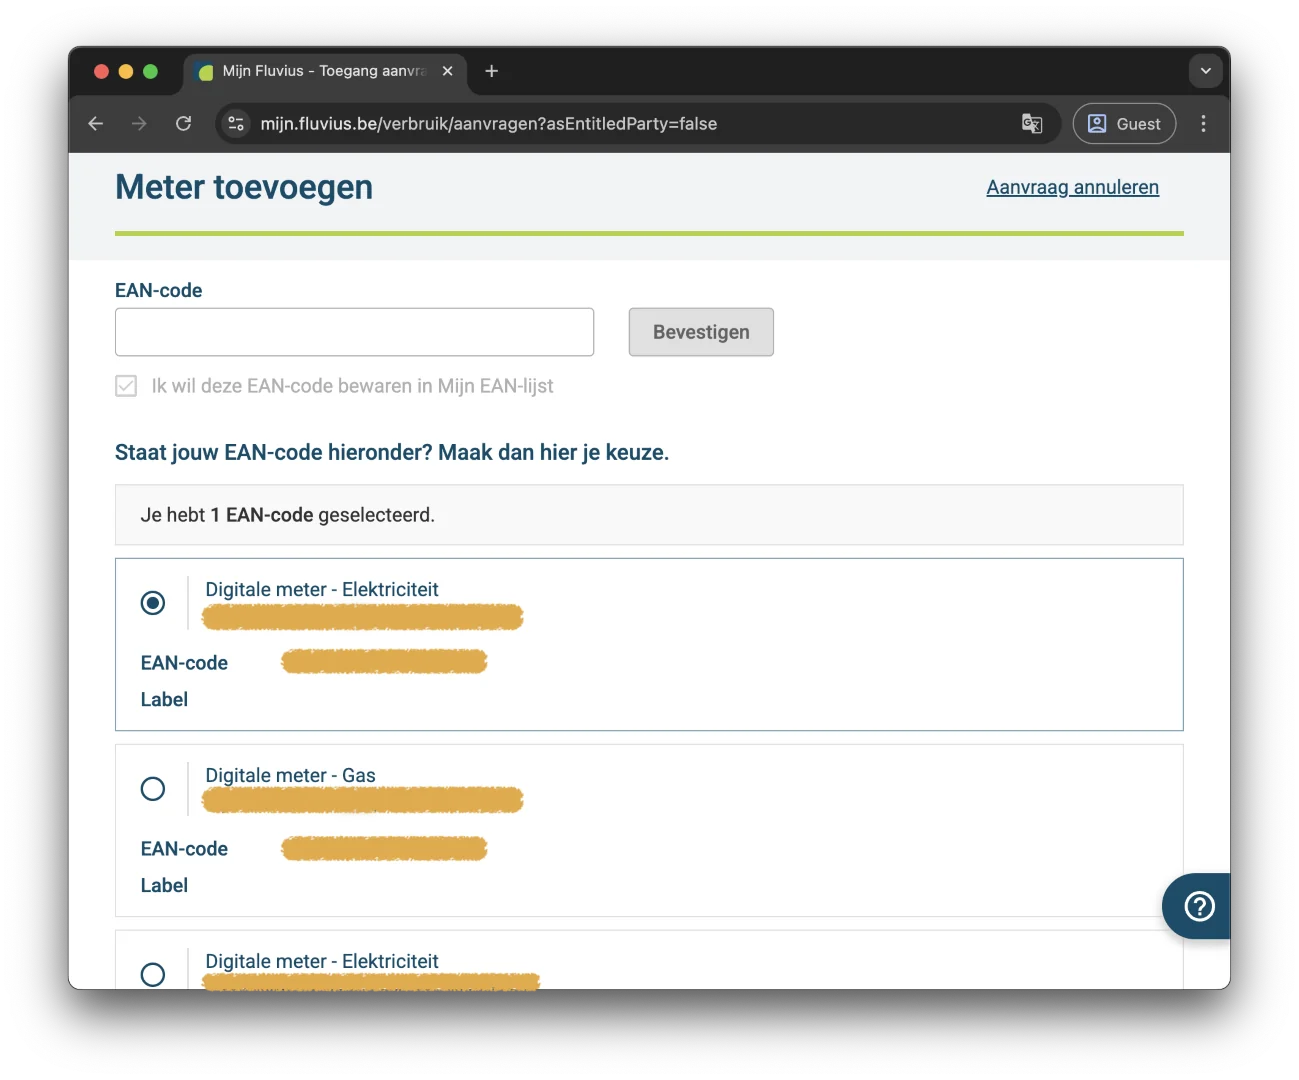
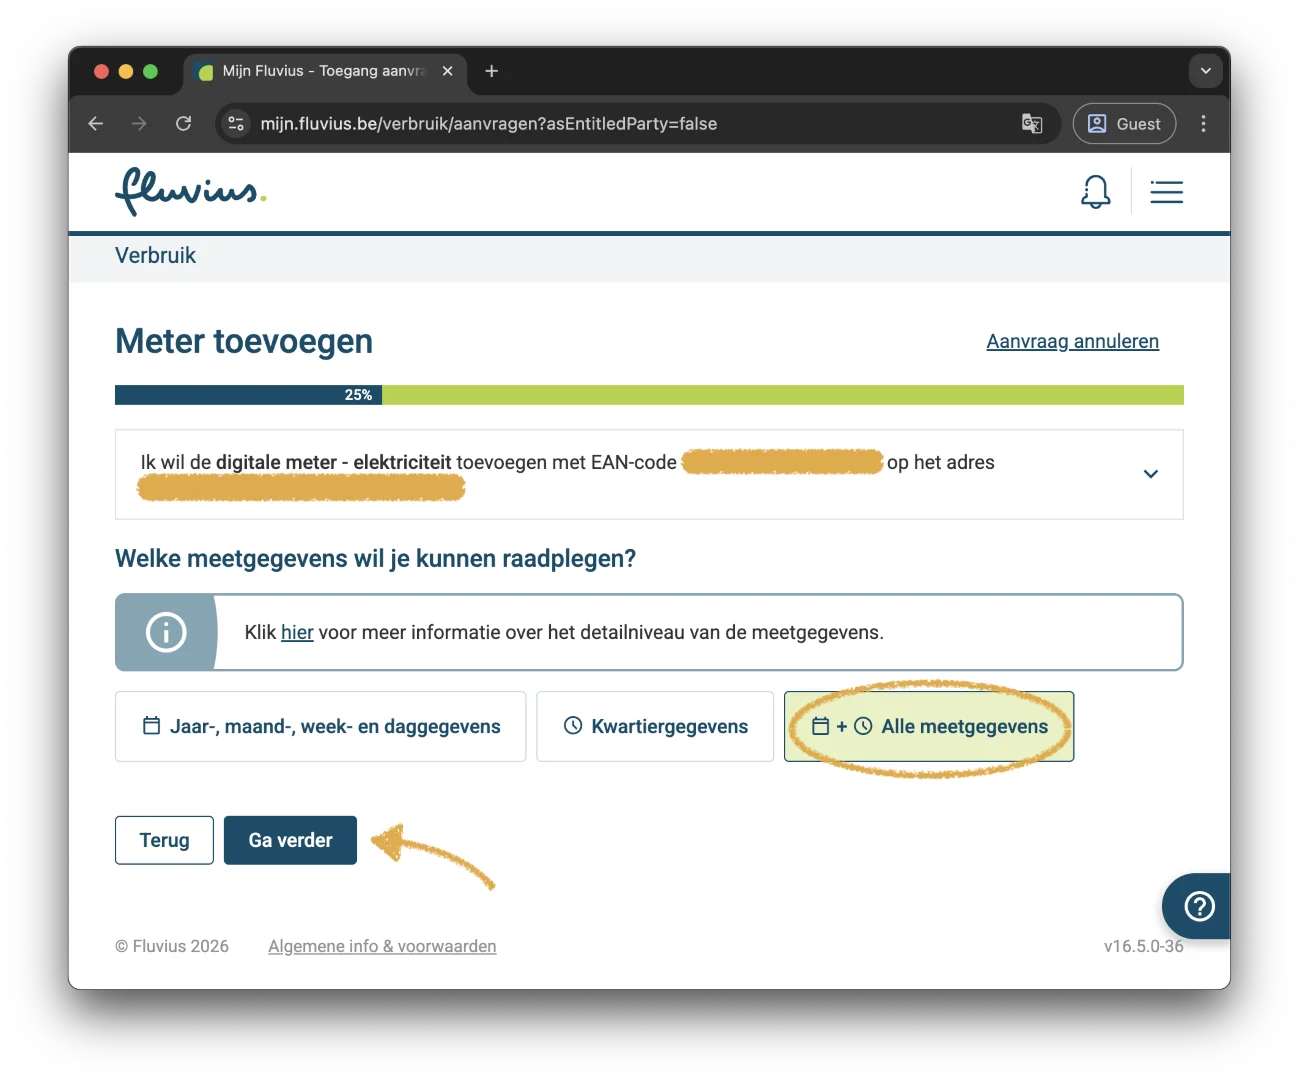
1.In the meter overview, click Meter toevoegen (add meter) and choose your digital electricity meter.
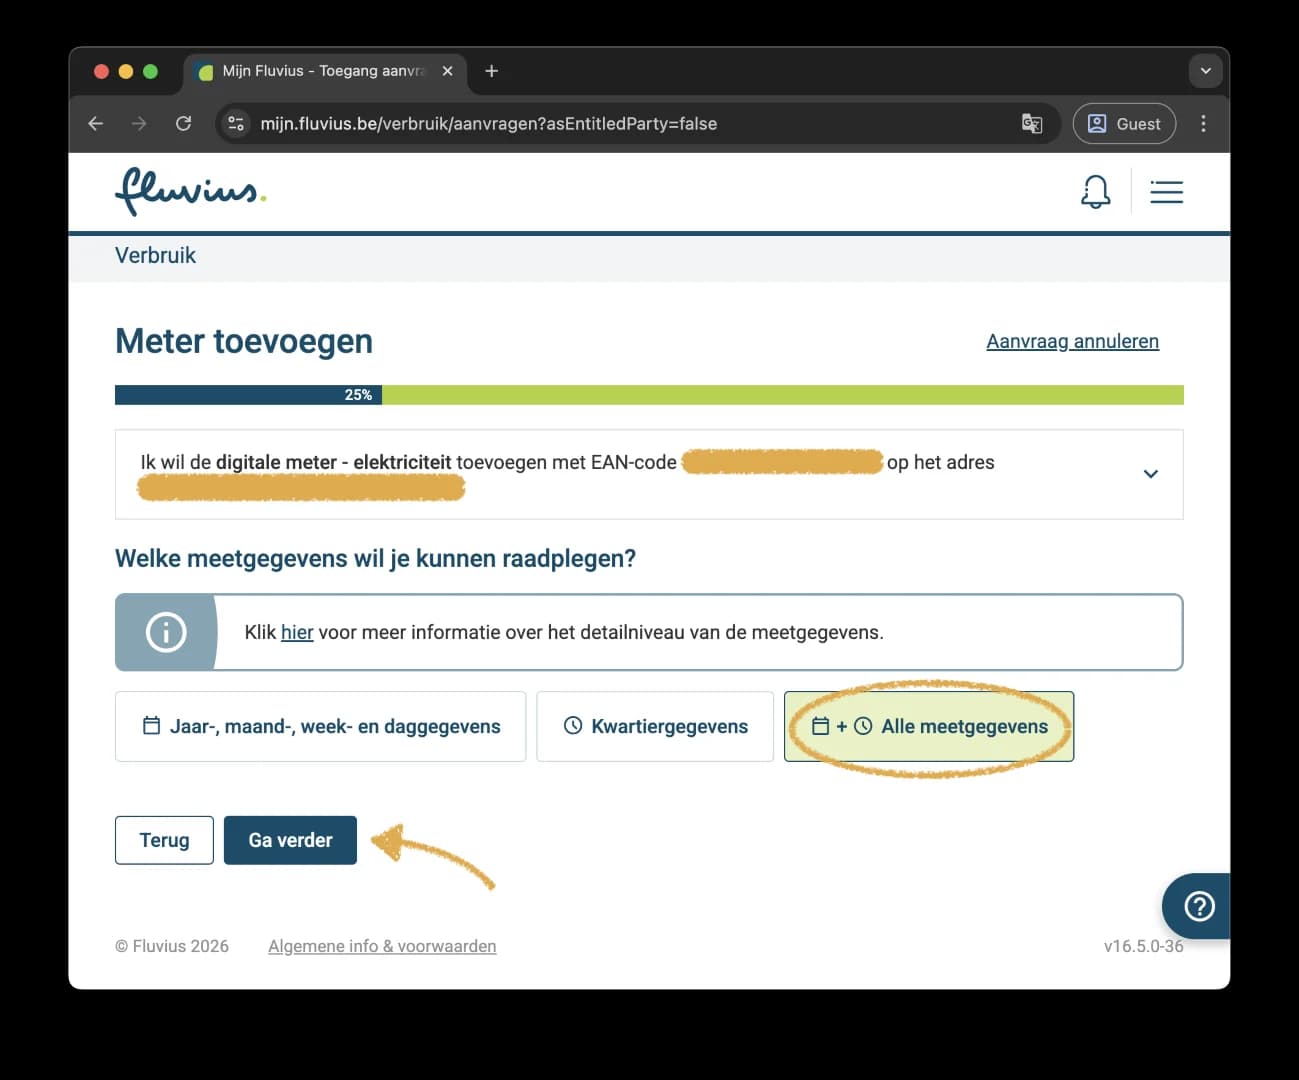
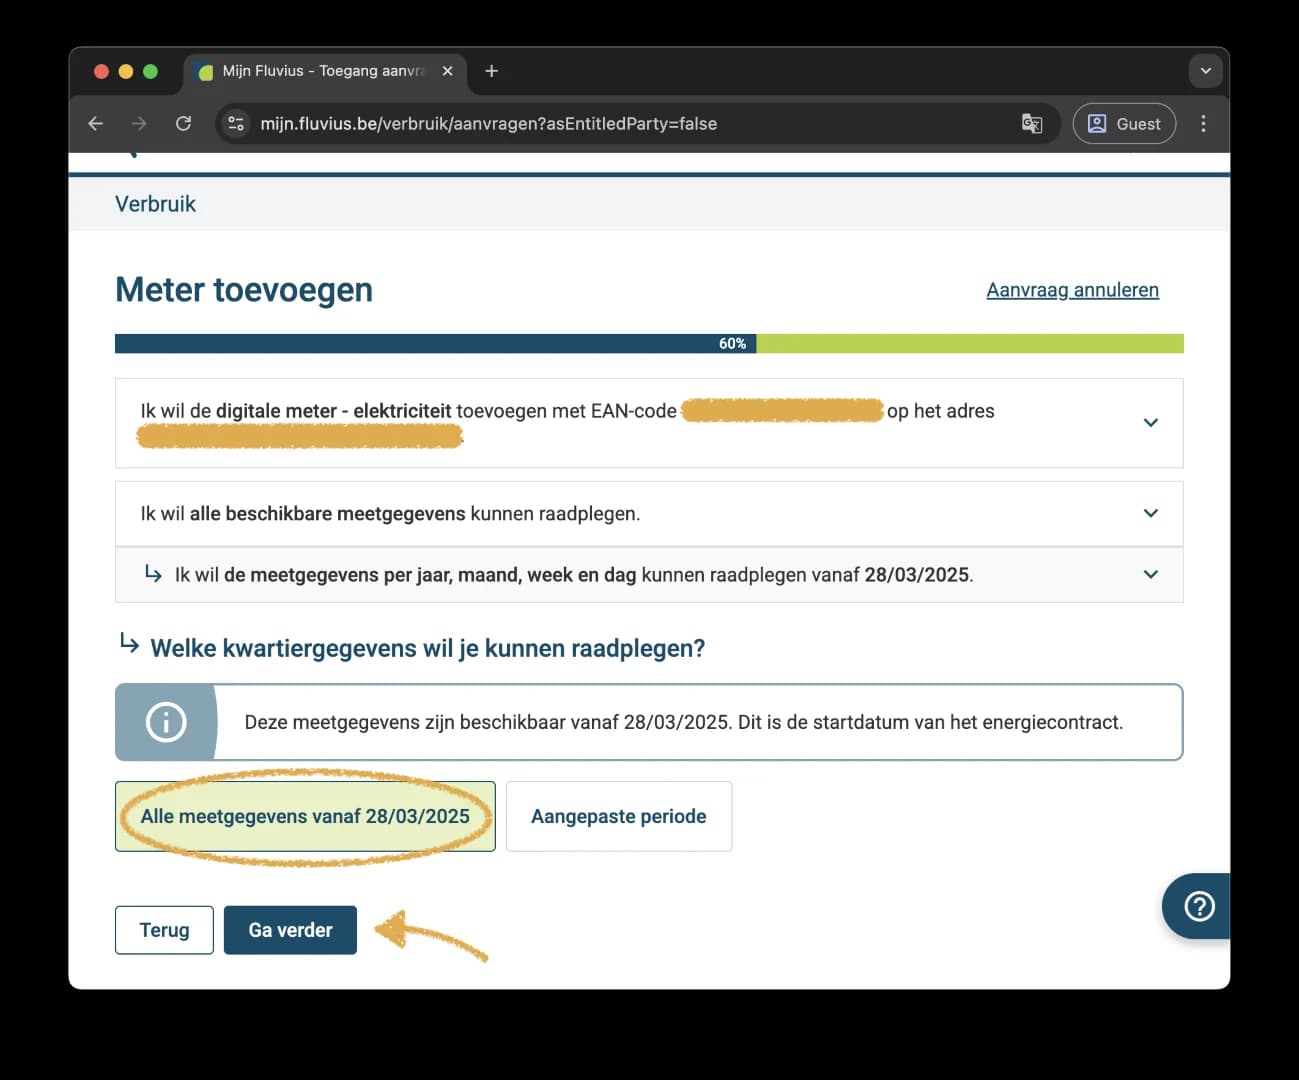
2.When asked which measurement data you want to view, choose Alle meetgegevens (all measurement data) and click Ga verder (continue).
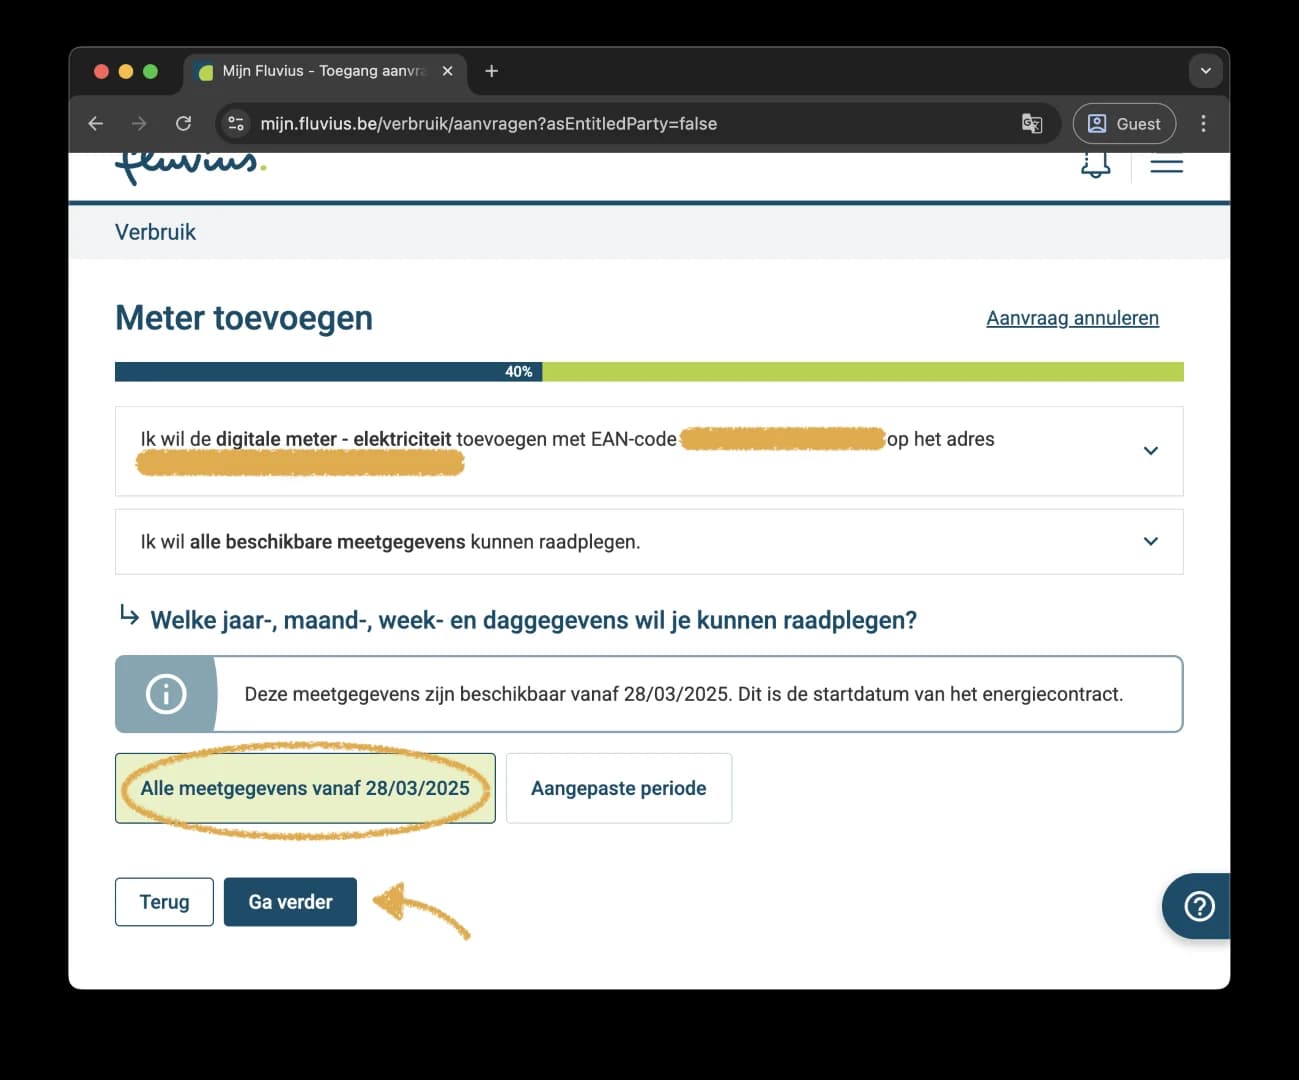
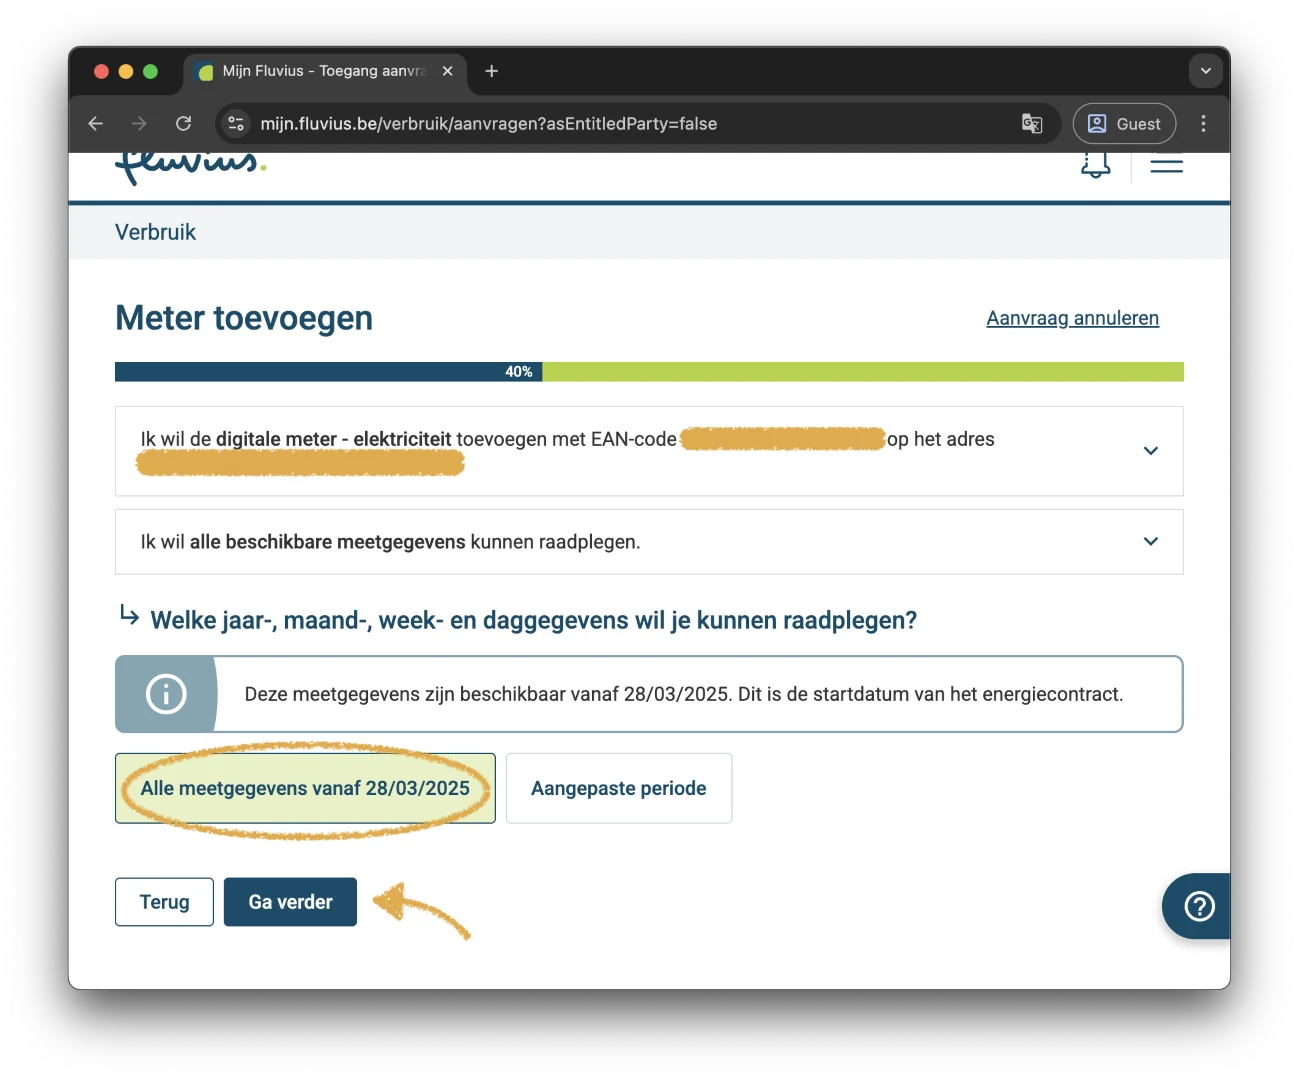
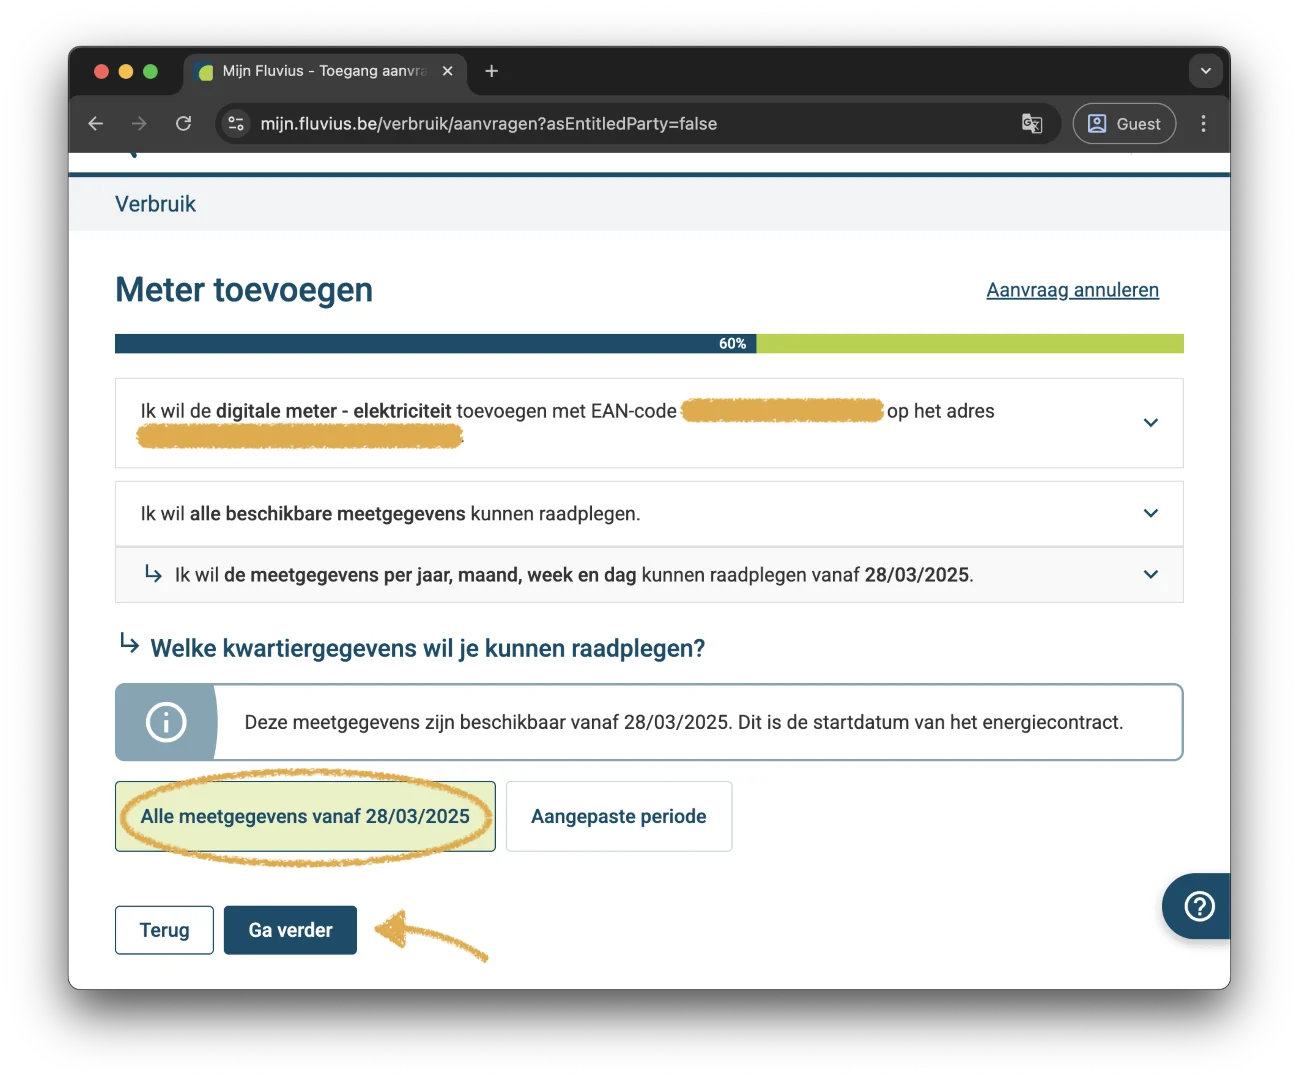
3.For the period, choose Alle meetgegevens vanaf … each time and click Ga verder. That gives you all available history, back to the start date of your energy contract at that address.
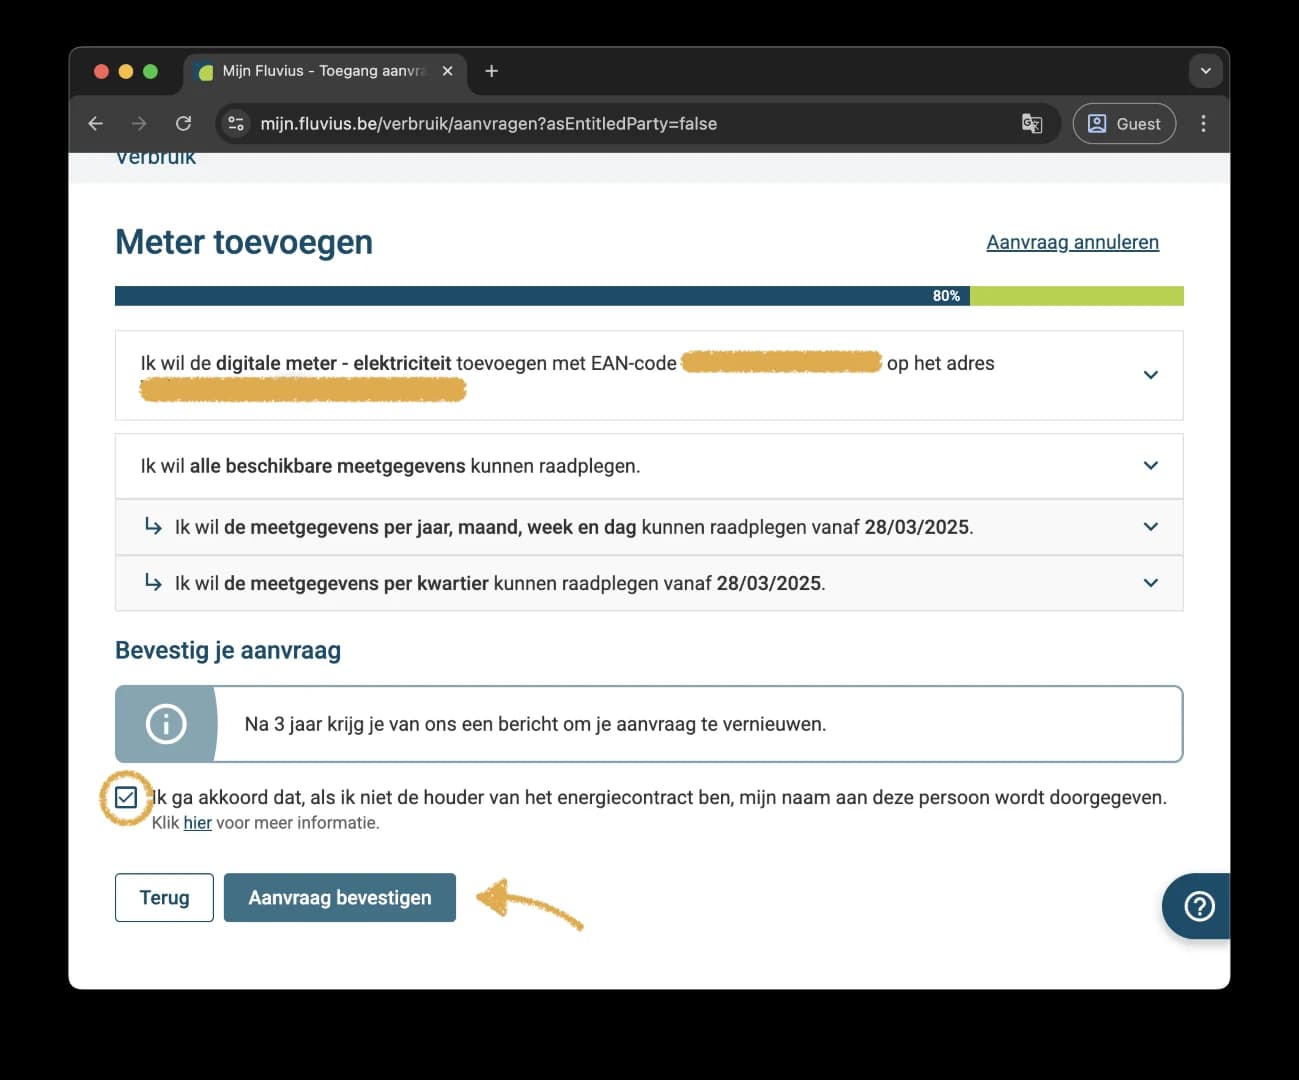
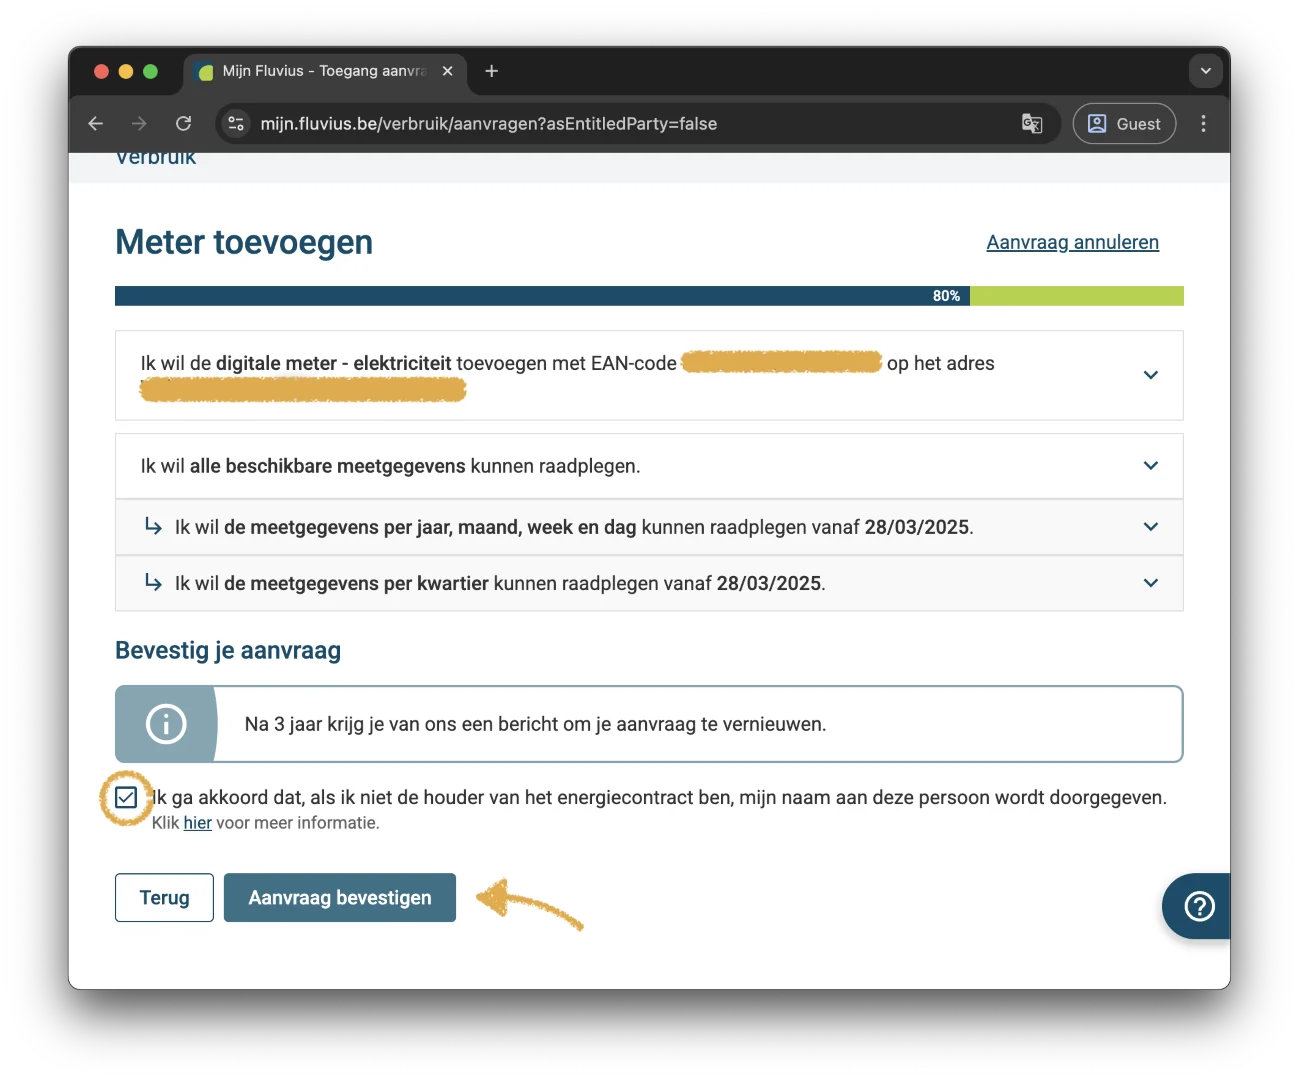
4.Tick the consent box and click Aanvraag bevestigen (confirm request).
The data usually appears in Mijn Fluvius the next day. Then continue with step 4.
Step 4 of 5
Download your quarter-hour totals as a CSV
In the meter overview, click your electricity meter to open its detail page.
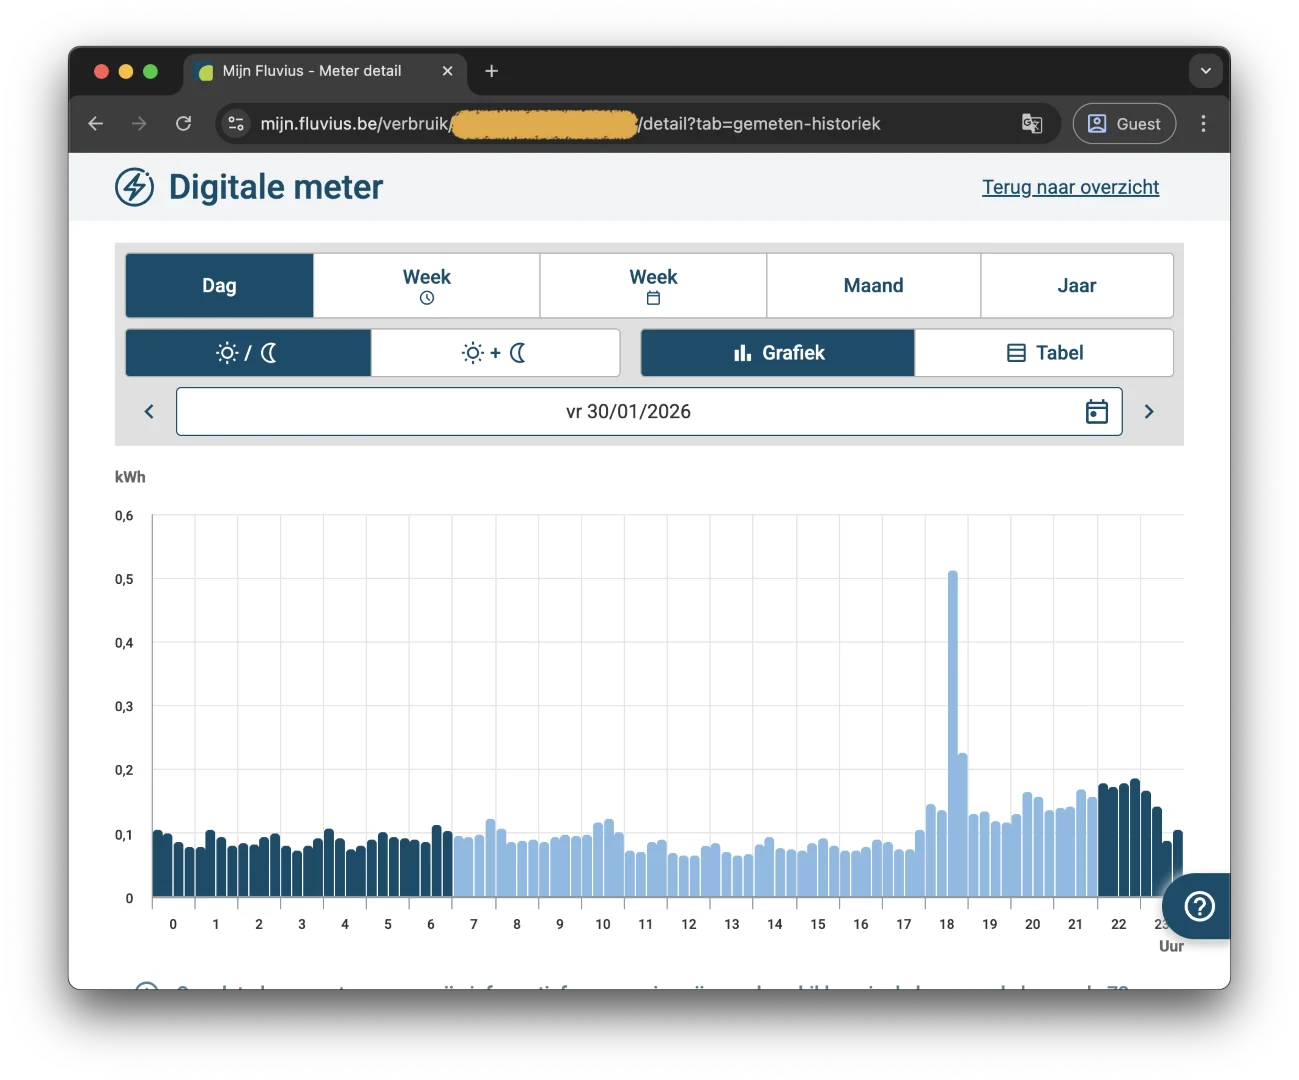
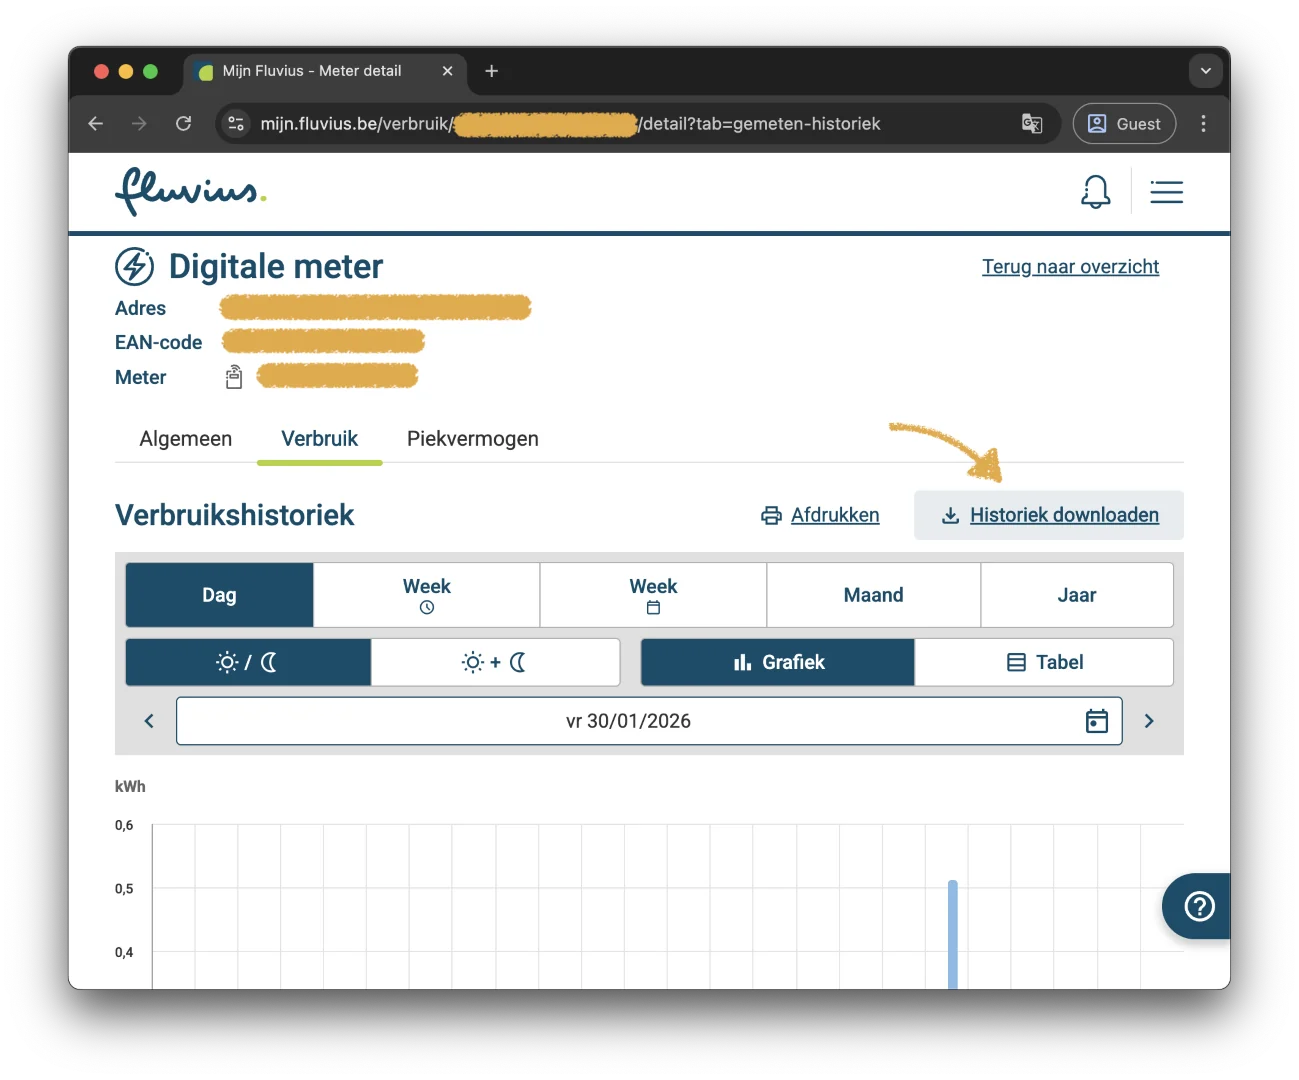
Open the Verbruik tab. Above the consumption history, on the right, you will find the Historiek downloaden (download history) button.
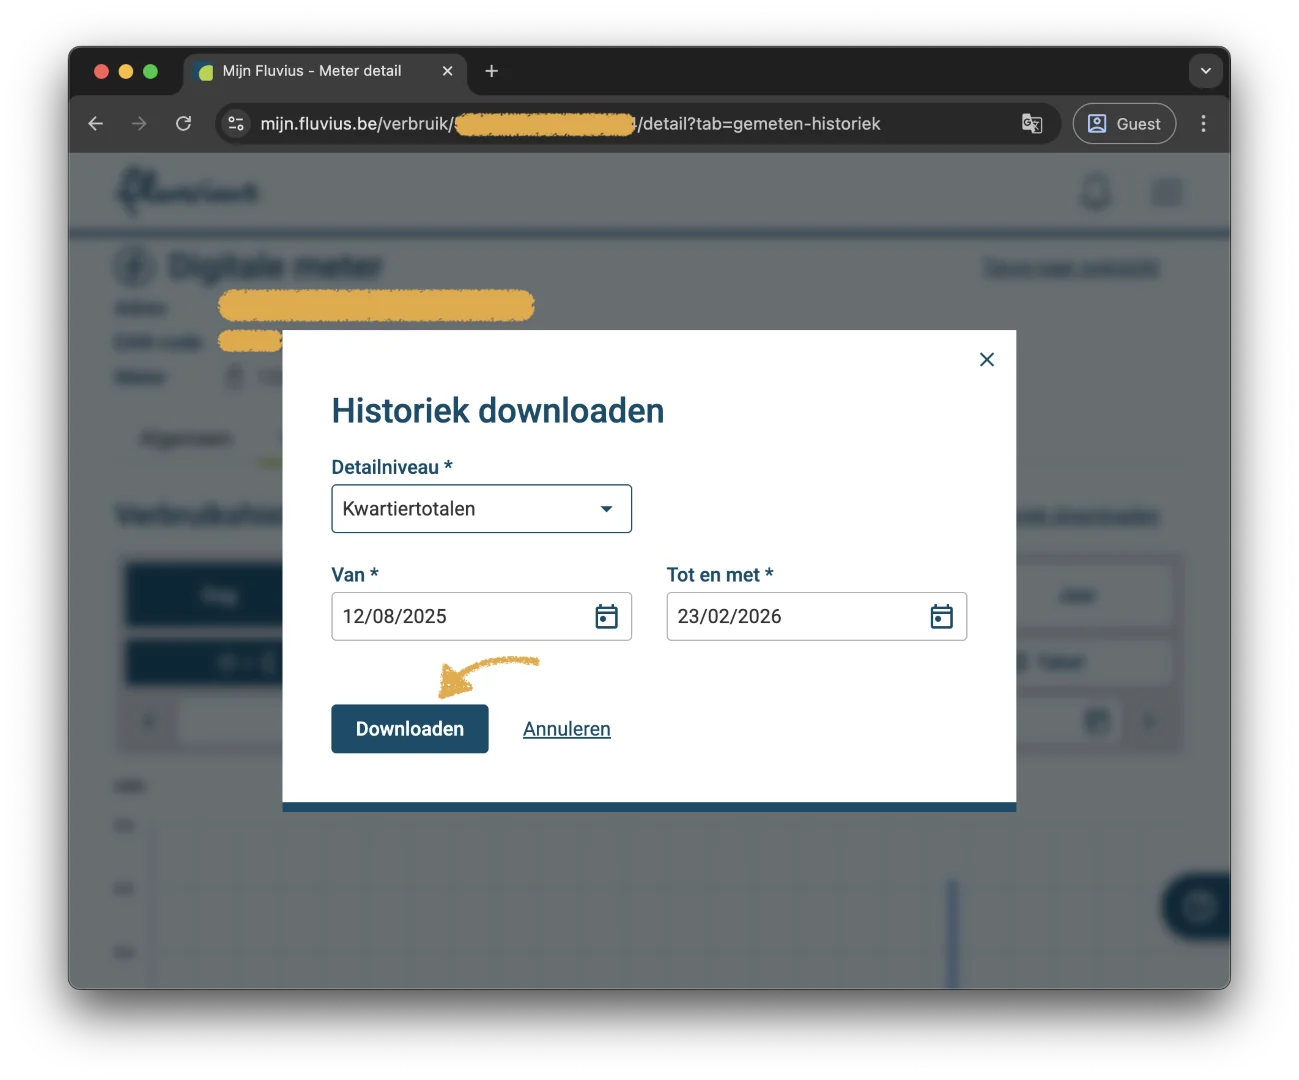
In the window that opens, fill in:
- Level of detail (Detailniveau): Kwartiertotalen
- Van and Tot en met (from / up to and including): at least 3 months, ideally the last 12 months
- Click Downloaden (download)
Why ideally 12 months?
We simulate every installation on 35,040 quarter-hour readings: a full year. That way both the winter peaks and the summer solar surpluses are included in the calculation, and your business case rests on your actual consumption rather than an estimate. With 3 months you already get a first indication.
Tip: also look at the Piekvermogen tab
It shows your highest quarter-hour peak for each month. That peak sets your capacity tariff, and that is exactly the peak a battery can flatten for you.
Step 5 of 5
Upload your CSV to InduBa
Enter your name and e-mail address below and choose your CSV file. We use it to run the full simulation for your business and get back to you.
If you have solar panels, consumption and injection sometimes come as two separate files. In that case, add both files.
Prefer to take a look yourself first? The free analysis immediately shows your peaks and your capacity tariff. That analysis runs in your own browser, without your file being sent to us.
Got your file?
Upload it in step 5: we run the full simulation and get back to you. Prefer to take a look yourself first? The free analysis shows your peaks right away.
Fluvius updates Mijn Fluvius from time to time. If your screen looks slightly different, look for the same buttons and terms.